
Transition from B2B to D2C eCommerce Brand
How we helped AMOCC build a D2C eCommerce engine from scratch—without seed data or historical benchmarks—using a stacked KPI approach.
How do we transition from B2B to D2C—using eCommerce as the main channel?
A Japanese furniture manufacturer with strong wholesale distribution needed to build a consumer brand and eCommerce revenue stream. The challenge: no first‑party seed data and no past D2C benchmarks.
Build awareness, then prove performance by stacking KPIs through the funnel.
Use Facebook/Instagram and Google to drive high-intent traffic, tag the site thoroughly, and measure performance at each funnel stage. Each stage KPI creates signal—even before purchase volume is meaningful.
A KPI Stack That Made Optimization Possible Without Initial Sales Data
Stacked KPIs are a practical way to grow eCommerce when you have no seed data: start by optimizing to reliable proxies (users and engaged sessions), then graduate to higher-intent actions (add‑to‑cart, checkout), and finally optimize to transactions once purchase volume is stable.
A KPI Stack That Made Optimization Possible Without Initial Sales Data
- Facebook + Instagram (Display)
- Google Display
- Display + Remarketing
- Remarketing (FB/Google)
- Social posts
- Organic + Paid Search
- Organic + Paid Search
- Email + Bookmarks
- Organic search
- Paid search
- Referrals
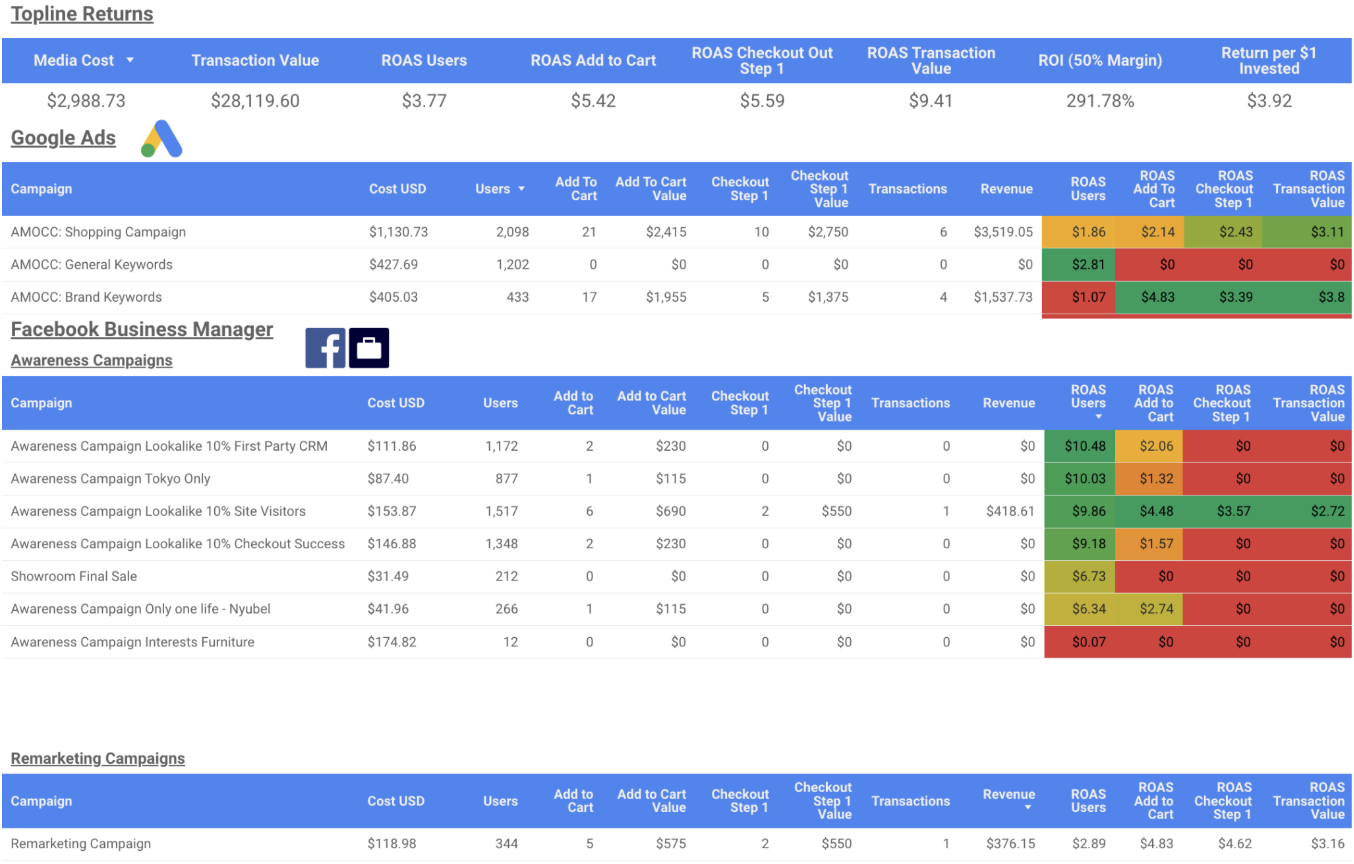
Weekly report (example)
This is an example of stacked KPIs in action. Early on, users and engagement can act as revenue proxies while you collect first‑party data. As volume grows, measurement shifts to higher‑intent actions—add to cart, checkout—and ultimately transactions.
Want this system for your business?
Every strategy starts with a conversation.